The JournalMeasurement
Raw, Cooked, and Miscounted: Where Your Macros Drift
Cooking moves water and fat, so raw and grilled chicken breast have very different entries in USDA’s database. Tracking goes wrong when food is weighed in one state and logged in the other.
- By
- ScalePod Editorial
- Published
- Reading time
- 11 min read
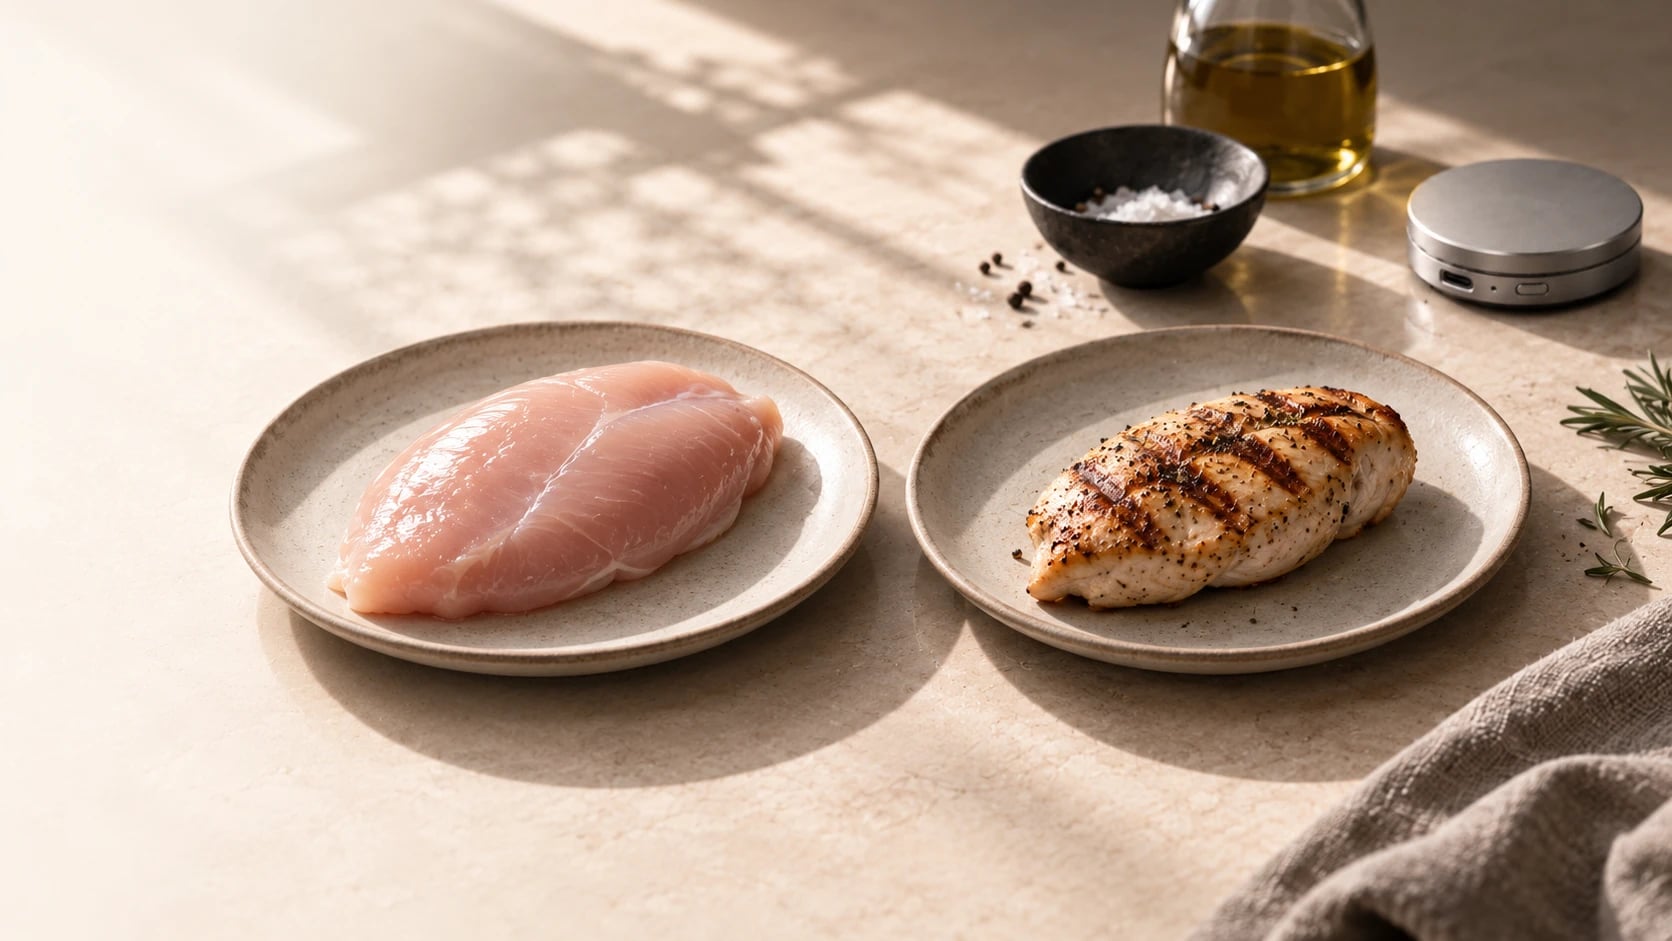
Grill a skinless chicken breast and, by USDA’s figures, its protein rises from 22.5 g to 30.5 g per 100 g 12. That is concentration, not added protein: water falls from 73.9 g to 66.1 g per 100 g, so roughly the same protein ends up in a lighter piece of meat.
Ground beef goes a step further. Pan-browned 80/20 crumbles list 272 kcal per 100 g, more than the 254 kcal of the raw meat 34, yet the meat lost fat as well as water 5. Per 100 g, energy went up. For the meat on the plate, it went down.
None of these numbers is wrong. Each describes concentration in one food in one state; the trouble starts when a weight taken in one state is logged against an entry for another.
The research at a glance
USDA FoodData Central, SR Legacy
- Study type
- Food-composition database (values per 100 g of edible portion)
- Sample
- 6 data points each for water, protein and fat in the raw and grilled chicken breast entries
- Published
- 2019
Roseland et al., USDA Table of Cooking Yields
- Study type
- Reference table of measured cooking yields
- Sample
- Medium-fat ground beef: n = 4 per preparation method
- Published
- 2014
- Key finding
- Medium-fat ground beef kept 67% of its raw weight as drained crumbles and 73% as a pan-broiled patty, losing both water and fat with every method 5.
- Important limitation
- Its chicken breast rows are 1975 figures for meat with skin; it has no row for skinless, boneless breast 5.
Park et al., Poultry Science
- Study type
- Laboratory cooking experiment
- Sample
- 70 broiler breast muscles (10 per condition)
- Published
- 2020
- Key finding
- With sous-vide, cooking loss rose with temperature and time, from 6.58% (60 °C, 1 hour) to 25.3% (70 °C, 3 hours); breast cooked in a 180 °C oven to 71 °C inside lost 26.5% 15.
- Important limitation
- Tightly controlled laboratory conditions: the losses show how wide the range can be, not what a home kitchen will produce 15.
The actual question
The question is about measurement, not physiology: if you weigh food raw and log it as cooked, or the reverse, how far off is the log, and how much does the cooking method matter? We found no peer-reviewed study measuring how often people make this mismatch or how large the error is in real logs.
What exists is guidance from those who build food-composition tables. The FAO/INFOODS food-matching guidelines grade raw-food values applied to cooked foods without adjustment as a low-quality match that produces major under- or overestimates of intake 6. In one example, pan-fried tomato matched to raw or boiled tomato comes out too low, because frying drives off water and adds oil.
How the database entries are built
The values here come from SR Legacy, the final edition of USDA’s National Nutrient Database for Standard Reference. Released in April 2018, it has been part of FoodData Central (FDC) since 2019 and is no longer updated 17. Entries report nutrients per 100 g of edible portion and mix laboratory analyses with calculations. The cooked 80/20 ground beef entries are labeled as analytical data derived by linear regression, from a study that modeled nutrients against fat content 45.
Raw and cooked versions of a food are separate records, not necessarily from the same samples or even the same decade. The raw and grilled skinless chicken breast entries each rest on six data points for water, protein and fat, both updated in 2013 12; the roasted breast entry rests on 1979 data 8; the rice entries date from 1989 and draw on different numbers of data points 910. Even for same-year pairs, FDC does not say whether the same pieces were analyzed before and after cooking.
Because analytical data for cooked foods are generally unavailable, most databases calculate cooked values from raw ones using cooking yields: hot cooked weight as a percentage of raw weight, reflecting moisture lost, water absorbed and fat gained or lost 5. USDA’s retention formula, used for vitamins and minerals, states the key distinction: the amount retained is concentration multiplied by the food’s weight, before versus after cooking 11. Concentration and total can move in opposite directions.
Energy is calculated too, from protein, fat and carbohydrate with conversion factors. FDC lists specific factors for some entries (4.27 kcal per gram of protein and 9.02 per gram of fat for raw chicken breast) and none for others, including grilled breast 12.
Concentration is not quantity
Muscle is roughly three-quarters water, and cooking mostly removes water: FSIS lists white-meat chicken with skin falling from about 69% to 61% water when cooked 12.
Chicken breast, meat only, per 100 g as listed in FoodData Central (SR Legacy) 1213814
| Entry (FDC ID) | Water (g) | Energy (kcal) | Protein (g) | Fat (g) |
|---|---|---|---|---|
| Raw (171077) | 73.9 | 120 | 22.5 | 2.62 |
| Grilled (171534) | 66.1 | 151 | 30.5 | 3.17 |
| Braised (171140) | 65.3 | 157 | 32.1 | 3.24 |
| Roasted (171477) | 65.3 | 165 | 31.0 | 3.57 |
| Fried (171078) | 60.2 | 187 | 33.4 | 4.71 |
Read down the protein column and every cooked entry looks like a better protein source. Mostly it is the same food with less water, though the fried entry also lists the most fat and some carbohydrate, consistent with frying fat or a coating 14. The two 2013 cooked entries differ by less than 2 g of protein per 100 g; the gap of about 3 g between grilled and fried also spans eras and product descriptions.
In ground beef, the higher figure per 100 g comes with less on the plate: USDA drained its browned crumbles in a colander, and its measured yields show both water and fat lost 5. Drippings stirred into a sauce are still eaten.
Three illustrative calculations
These examples are arithmetic on the cited FDC values, as displayed on the FDC site. Each cooked weight is implied, not measured, by assuming one component, usually protein, survives cooking unchanged. That is our simplifying assumption, not a USDA method, and the answer shifts with the component chosen.
Illustrative example: 200 g of raw chicken breast, grilled
Raw (FDC 171077): 200 g provides 45.0 g protein, 5.24 g fat and 240 kcal 1.
Implied cooked weight: if all the protein is retained, the grilled entry’s 30.5 g per 100 g implies about 148 g, a yield of about 74% 2. Anchored on dry matter, the implied yield is about 77%; on fat, about 83%. FDC’s portion records (272 g per raw piece, 196 g per grilled piece) suggest 72%, but they are separate records, not a documented before-and-after weighing.
Cooked weight, raw entry: 148 g logged as raw breast gives 33.3 g protein, about 26% too little. Raw weight, cooked entry: 200 g logged as grilled breast gives 61.0 g protein, about 36% too much.
Matched pairings still disagree on energy: 240 kcal from the raw side, about 223 kcal from the grilled side. Part of the gap looks like a conversion artifact: the grilled entry’s 151 kcal fits the general 4 and 9 kcal per gram, not the specific factors listed for raw breast, which would give about 159. That is our arithmetic, not a USDA statement.
Illustrative example: 75 g of dry long-grain white rice
Dry (FDC 168877): 75 g provides about 274 kcal and 60.0 g carbohydrate 9.
Implied cooked weight: the cooked entry lists 130 kcal and 28.2 g carbohydrate per 100 g 10. Matching dry matter, 75 g of dry rice becomes about 210 g cooked, a multiplier of about 2.8 (2.84 by carbohydrate, 2.65 by protein). We found no cooking ratio stated for the entry, and real cooked rice can be wetter or drier.
Dry weight, cooked entry: 97.5 kcal and about 21 g carbohydrate, roughly 64% too little. Cooked weight, dry entry: about 767 kcal, roughly 2.8 times the matched 274.
By the cup: FDC’s portion weights put a cup of raw rice (185 g) at about 675 kcal and a cup of cooked rice (158 g) at about 205 kcal, a more than threefold gap 910.
Illustrative example: 100 g of raw 80/20 ground beef, browned
Raw (FDC 174036): 100 g provides 254 kcal, 17.2 g protein and 20.0 g fat 3.
Implied cooked weight: if all the protein is retained, the crumbles entry’s 27.0 g per 100 g implies just under 64 g of drained crumbles, carrying roughly 173 kcal and 11 g fat 4. That works out to a fat loss of about 9 g, more than the 5.32% of raw weight USDA measured for pan-fried crumbles in its medium-fat (12% to 22%) category, where the yield was 67% (range 63.7% to 71.6%, n = 4) 5. Both draw on USDA’s ground beef study, but the FDC values are regression predictions for 20% fat and the yield is a category mean, so the two are not directly comparable.
Raw weight, cooked entry: 272 kcal, about 57% more than the implied 173. Cooked weight, raw entry: about 162 kcal, close by coincidence, but 11.0 g protein instead of 17.2 g.
Why no single yield is right
In USDA’s table, medium-fat ground beef keeps 67% to 73% of its raw weight depending on method, losing about 21% to 28% of raw weight as moisture and 5% to 6% as fat. Low-fat beef keeps more (69% to 77%); high-fat beef keeps less (62% to 69%), losing about 12% to 13% as fat 5. The Beef Checkoff Program funded the ground beef study.
Time and temperature matter too. In a laboratory experiment on 70 broiler breast muscles (10 per condition), cooking loss ran from 6.58% after one hour of sous-vide at 60 °C to 25.3% after three hours at 70 °C, and 26.5% in a convection oven at 180 °C 15. Both factors had clear effects (P < 0.001); the absence of a significant interaction does not prove they simply add up. These laboratory figures show the size of the range, not a yield to use. FSIS adds that higher temperatures drive off more moisture, and that a beef roast cooked hot or long can lose about a third of its weight 12.
Cut matters as well, and the data run thin. USDA’s yields table gives roasted chicken with skin 72% for breast, 69% for thigh and 76% for drumstick, all from 1975, and has no row for skinless, boneless breast 5.
Water can also arrive before cooking. FSIS notes that retained-water declarations of 8% to 12% are not unusual for poultry, and that an added solution must appear in the product name and counts toward net weight 12. FDC’s raw breast with added solution lists 20.3 g protein and 173 mg sodium per 100 g, against 22.5 g and 45 mg for the plain entry 161. US rules also let single-ingredient raw poultry that is not ground or chopped declare nutrition as consumed rather than as packaged 17.
What the numbers can and cannot show
All of this is arithmetic on reference data and inherits its limits. Gaps between entries are not clean causal effects: raw versus roasted chicken reflects cooking, but also samples analyzed decades apart. The sous-vide experiment supports a causal reading, but only within its controlled setup 15.
Most important, a logging error in one meal says nothing about results over a training block, and we found no research on whether these mismatches change body-composition outcomes. A reasonable inference, not a finding, is that a mismatch repeated daily, such as always logging cooked rice against the raw entry, is systematic and will not average out. SR Legacy is also frozen; newer FDC data types may list different values, so the arithmetic carries over but the exact numbers may not 17.
Making the log match the plate
The arithmetic is solid; its effect on results is not. A few habits are a proportionate response:
- Weigh and log in one state. Raw weight goes with a raw entry, cooked weight with a cooked entry for the same method.
- Use raw totals for batch cooking. Log the raw ingredients, weigh the cooked batch and assign portions by cooked weight; for drained fatty meat, raw totals overstate fat.
- Weigh grains and note the state. A cup of dry rice carries more than three times the energy of a cup of cooked rice 910.
- Log what you add. Oil, butter, marinades, breading and sauces made from drippings.
- Read the package. Look for added solution, retained water and whether the panel is as packaged or as consumed 1217. If you are on a sodium-restricted diet for a medical reason, ask your clinician about added-solution products.
What we know
- Cooking changes weight, mostly through water and, for many meats, fat 512.
- Raw and cooked versions of a food have separate entries with very different values per 100 g 12910.
- A higher value per 100 g after cooking can reflect water loss alone; on its own it says nothing about the total 4511.
- Yields vary with method, time, temperature, cut and fat content 515.
- Food-matching guidelines rate raw values applied to cooked food without adjustment as a low-quality match 6.
What we don’t know
- How often people who track food mismatch raw and cooked entries, and how large the error is in practice.
- The home-cooked yield of skinless, boneless chicken breast; USDA’s yields table has no such row 5.
- Whether protein is fully retained during cooking, as the implied yields here assume.
- Whether these logging errors affect body-composition outcomes over weeks or months.
The practical takeaway
- In these examples, grains logged in the wrong state produced the largest errors; meat errors were smaller but still large.
- Weighing and logging in one state, with an entry for the right cooking method, removes the raw/cooked mismatches shown above; a home-cooked food can still differ from its database entry.
- Any cooked-weight conversion is approximate, because yields vary with method, time, cut and fat content.
A note from ScalePod
A scale gives a portion’s actual weight, not whether it is raw or cooked. ScalePod’s scale measures weight only; the app helps identify the food and estimate its nutrition, and that estimate depends on matching the food’s state.
A database entry answers a narrower question than a food log asks: how much of each nutrient is in 100 g of this food, in this state, prepared this way. A log is only as accurate as the match between the weight and the entry.
Written by ScalePod Editorial from the sources listed below. This article is general information for healthy, trained adults, not medical or dietary advice.
References
1. USDA Agricultural Research Service. Chicken, broiler or fryers, breast, skinless, boneless, meat only, raw (FDC ID 171077). FoodData Central, SR Legacy, 2019. fdc.nal.usda.gov/food-details/171077/nutrients (opens in a new tab)
2. USDA Agricultural Research Service. Chicken, broiler or fryers, breast, skinless, boneless, meat only, cooked, grilled (FDC ID 171534). FoodData Central, SR Legacy, 2019. fdc.nal.usda.gov/food-details/171534/nutrients (opens in a new tab)
3. USDA Agricultural Research Service. Beef, ground, 80% lean meat / 20% fat, raw (FDC ID 174036). FoodData Central, SR Legacy, 2019. fdc.nal.usda.gov/food-details/174036/nutrients (opens in a new tab)
4. USDA Agricultural Research Service. Beef, ground, 80% lean meat / 20% fat, crumbles, cooked, pan-browned (FDC ID 171799). FoodData Central, SR Legacy, 2019. fdc.nal.usda.gov/food-details/171799/nutrients (opens in a new tab)
5. Roseland JM, Nguyen QV, Williams JR, et al. USDA Table of Cooking Yields for Meat and Poultry, Release 2. USDA Agricultural Research Service, Nutrient Data Laboratory (documentation in PDF; yield values in the accompanying Excel data table), 2014. www.ars.usda.gov/northeast-area/beltsville-md-bhnrc/beltsville-human-nutrition-research-center/methods-and-application-of-food-composition-laboratory/mafcl-site-pages/cooking-yields/ (opens in a new tab)
6. Stadlmayr B, Wijesinha-Bettoni R, Haytowitz D, et al. FAO/INFOODS Guidelines for Food Matching, Version 1.2. Food and Agriculture Organization of the United Nations, Rome, 2012. www.fao.org/fileadmin/templates/food_composition/documents/Nutrition_assessment/INFOODSGuidelinesforFoodMatching_version_1_2.pdf (opens in a new tab)
7. Haytowitz D, Ahuja J, Wu X, et al. USDA National Nutrient Database for Standard Reference, Legacy Release. Ag Data Commons, USDA Agricultural Research Service (dataset; part of FoodData Central), 2019. doi.org/10.15482/USDA.ADC/1529216 (opens in a new tab)
8. USDA Agricultural Research Service. Chicken, broilers or fryers, breast, meat only, cooked, roasted (FDC ID 171477). FoodData Central, SR Legacy, 2019. fdc.nal.usda.gov/food-details/171477/nutrients (opens in a new tab)
9. USDA Agricultural Research Service. Rice, white, long-grain, regular, raw, enriched (FDC ID 168877). FoodData Central, SR Legacy, 2019. fdc.nal.usda.gov/food-details/168877/nutrients (opens in a new tab)
10. USDA Agricultural Research Service. Rice, white, long-grain, regular, enriched, cooked (FDC ID 168878). FoodData Central, SR Legacy, 2019. fdc.nal.usda.gov/food-details/168878/nutrients (opens in a new tab)
11. USDA Agricultural Research Service, Nutrient Data Laboratory. USDA Table of Nutrient Retention Factors, Release 6. USDA Agricultural Research Service, 2007. www.ars.usda.gov/ARSUserFiles/80400525/Data/retn/retn06.pdf (opens in a new tab)
12. USDA Food Safety and Inspection Service. Water in Meat and Poultry. FSIS, Food Safety Basics (last updated January 8, 2025), 2025. www.fsis.usda.gov/food-safety/safe-food-handling-and-preparation/food-safety-basics/water-meat-poultry (opens in a new tab)
13. USDA Agricultural Research Service. Chicken, broiler or fryers, breast, skinless, boneless, meat only, cooked, braised (FDC ID 171140). FoodData Central, SR Legacy, 2019. fdc.nal.usda.gov/food-details/171140/nutrients (opens in a new tab)
14. USDA Agricultural Research Service. Chicken, broilers or fryers, breast, meat only, cooked, fried (FDC ID 171078). FoodData Central, SR Legacy, 2019. fdc.nal.usda.gov/food-details/171078/nutrients (opens in a new tab)
15. Park CH, Lee B, Oh E, et al. Combined effects of sous-vide cooking conditions on meat and sensory quality characteristics of chicken breast meat. Poultry Science 99(6):3286–3291, 2020. doi.org/10.1016/j.psj.2020.03.004 (opens in a new tab)
16. USDA Agricultural Research Service. Chicken, broilers or fryers, breast, skinless, boneless, meat only, with added solution, raw (FDC ID 171509). FoodData Central, SR Legacy, 2019. fdc.nal.usda.gov/food-details/171509/nutrients (opens in a new tab)
17. USDA Food Safety and Inspection Service. 9 CFR 381.409: Nutrition label content. Code of Federal Regulations, Title 9, Chapter III, Part 381 (text via Legal Information Institute, Cornell Law School; accessed October 2026), 2026. www.law.cornell.edu/cfr/text/9/381.409 (opens in a new tab)